Sivic Cloud DAS
ReservationAdvanced data analysis, statistical modeling, and experimental design tools
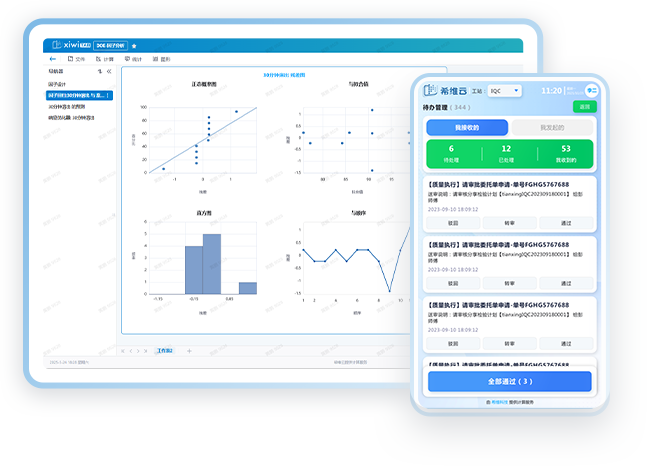
A professional statistical analysis software that meets the needs of anyone who needs data to solve problems. Especially suitable for the fields of Six Sigma and quality management. By providing advanced data analysis, statistical modeling, and experimental design tools, we help users more efficiently and accurately parse and optimize data.
Accurate analysis
Insight into the essence of data
Intuitive presentation of data
Comprehensive quality control
Through powerful analysis capabilities, we delve into the intrinsic connections between variables, efficiently screen and optimize key parameter combinations, construct predictive models, and provide data support for decision-making.
Accurate analysis
Provide comprehensive descriptive statistical analysis tools, including key indicators such as mean and standard deviation, to quickly grasp data characteristics.
Insight into the essence of data
With the help of rich data visualization functions such as bar charts, scatter plots, quality control charts, etc., complex data relationships are presented in an intuitive graphical way, making it easy to identify trends and discover anomalies.
Intuitive presentation of data
A powerful assistant in quality management, particularly excelling in Six Sigma and Statistical Process Control, monitoring production processes in real-time and continuously improving product quality.
Comprehensive quality control
Accurate analysis
Through powerful analysis capabilities, we delve into the intrinsic connections between variables, efficiently screen and optimize key parameter combinations, construct predictive models, and provide data support for decision-making.
Insight into the essence of data
Provide comprehensive descriptive statistical analysis tools, including key indicators such as mean and standard deviation, to quickly grasp data characteristics.
Intuitive presentation of data
With the help of rich data visualization functions such as bar charts, scatter plots, quality control charts, etc., complex data relationships are presented in an intuitive graphical way, making it easy to identify trends and discover anomalies.
Comprehensive quality control
A powerful assistant in quality management, particularly excelling in Six Sigma and Statistical Process Control, monitoring production processes in real-time and continuously improving product quality.
High-Precision Calculation
Multi core processing, cloud/local GPU acceleration
Efficient self-developed numerical optimization algorithms, matrix operations, and statistical model fitting
User-Oriented
Actively collect user feedback and make improvements based on the needs and suggestions of domestic users.
Localization substitution
Core algorithms and technologies independently developed to address software copyright risks
local service
Provide localized professional technical support services to help users solve technical problems. Twice monthly version releases
Consulting Prices
Recommend the best solution for you
Reservation
One click appointment, expert demonstration
Contact Number
400-105-9339
Friendship Link:
Service Hotline
400-105-9339
Contact Email
marketing@rowesfashion.com
Social Media
Official WeChat Account
WeChat Consultation
Copyright © 2025 Sivitech (Guangzhou) Co., Ltd. all rights reserved
Reservation
Consult
Schedule A Demo
*Your name
*phones Number
*Position Affiliation
*Corporate Name
*Products Of Interest
*Requirement Description
Consulting Prices
*Your name
*phones Number
*Position Affiliation
*Corporate Name
*Products Of Interest
*Requirement Description